Gisborne, Poverty Bay. weather
Latitude S 38° 39' 21" Longitude E 178° 02' 10" Elevation 14 m
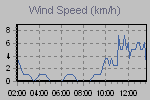
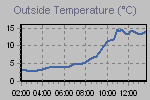
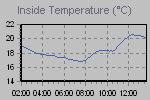
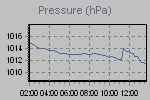
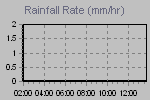
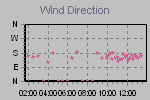
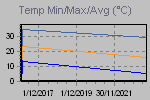
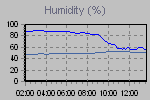
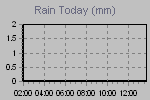
These graphs present the temperature, pressure, rainfall, and wind speed trends for the last 12 hours.
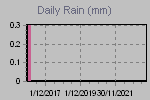
The thumbnail graphs are sampled every ten minutes. Click on a thumbnail to display the corresponding larger graph in the panel above it. The large graphs are sampled every minute.

| Click on a thumbnail to show a large graph in the panel above. | ||||
 |
 |
 |
 |
 |
 |
 |
 |
 |
 |
| :Now:::Today:::Yesterday:::This Month::This Year::Records::NZLWF Records: :Monthly Records:::Gauges:::Contact:::Trends:::NZLWF Forum:::Weather Underground: |
||||
Page updated 22/07/2024 9:00:00 a.m.
powered by
Cumulus v1.9.4 (10992)